U.S. Industrial real estate sublease market surges. Inventories expand ahead of retail peak season. Warehouse services pricing continues to decline.
Jacob Roseburrough Director of Marketing
Executive Summary
-2.6 percentdecrease in the national average of warehouse storage costs year-over-year in Q3 ’24 vs Q3’ 23, with a -0.5 percent decrease quarter-over-quarter
The national average of warehouse storage costs has seen a decrease in 9 consecutive months but remains up +11.7 percent since Q3 ’21.
Logistics Manager Index Inventory Levels expand to an aggregate rating of 59.8, signaling the seasonal buildup of inventories ahead of peak season
The U.S. sublease market of industrial real estate hits 199 million square feet of space, the most since 2009
The Warehouse Pricing Index (WPI) is now available in Journal of Commerce’s extensive, multi-channel dashboard, Gateway. Learn more about Gateway and how WarehouseQuote is helping logistics managers make smart supply chain decisions.
U.S. Warehousing Market Watch
6.4% National Industrial Real Estate Vacancy Rate
59.8 Index Reading for Downstream Inventory Levels (LMI)
-2.6% Decrease in the National Average of Warehouse Storage Costs, (YOY)
U.S. Sublease Availability of U.S. Industrial Real Estate
The amount of U.S. sublease availability of industrial real estate hit an all-time high in Q3 at 199 million square feet (Savills). This is up 45% from the previous year and exceeding the previous peak in 2009 at 124 million square feet of industrial real estate. This is a shippers’ market and a great opportunity for brands to re-evaluate their warehousing and fulfillment strategies.
Over the first three quarters of 2024, many retail brands re-evaluated their 3PL fulfillment strategies and some switched providers in an attempt to improve service levels, resolve operational issues, or optimize costs. Now, it’s Q4 and time to see if logistics and supply chain managers made the right operational decisions.
We’ve compiled a list of helpful retail peak season resources below:
The National Warehouse Pricing Index (WPI) decreased in Q3 '24 vs Q3’ 23,down 2.6 percent year-over-year. The West Coast region has experienced increases in warehouse capacity for prospective customers as warehouse operators have ample vacancy due to downstream inventory levels shrinking, decreasing warehousing utilization rates for facilities specializing in handling finished goods.
Regional Warehouse Pricing Index
All U.S. regions have seen a pricing decrease year-over-year for warehousing services. The Midwest was marginally down at -.5%, followed by steeper declines in the Northeast, South, West regions at -2.6%, -2.5%, and -4.1%, respectively.
The Voice of the Warehousing Market
The voice of WarehouseQuote
"We've started to see retail clients ramp up inventories ahead of retail peak season. We're actively working with our retail clients to optimize their label compliance and routing workflows to mitigate chargebacks and ensure a smooth retail peak season." - Paul Harris, VP of Operations at WarehouseQuote
Exclusive Commentary from S&P Global Market Intelligence, C.H. Robinson, and MyFreightWorld
Big Problems come in Small Packages: The Future for De Minimis Shipping
Chris Rogers Head of Supply Chain Research, S&P Global Market Intelligence
Global supply chains have been built on container shipping, air freight and large-scale shipping, but the recent surge in traffic has been driven in part by small packages shipping under “de minimis” rules.
The US government is initiating new rules regarding the use of “de minimis” import strategies. These involve shipments under $800 in value not having to pay duties.
The administration’s rules appear to be aimed at the textile and apparel industry, and specifically those originating in mainland China. Functionally the new rules won’t outlaw de minimis per se, rather limit its use to exclude products covered by several specific tariff regimes including the Section 201 and Section 301 duties applied to imports from mainland China.
US imports of de minimis products have increased by 29% year over year on an annualized basis in 2024 in terms of number of packages, S&P Global Market Intelligence analysis of official figures shows. At the same time, the average value per package has fallen by 32% year over year to $35 per item, reflecting heavier use in e-commerce settings.
The administration’s announcement has received broad bipartisan support, with the White House arguing that Congress should pass new legislation outlining de minimis policy. If such legislation passes Congress, most likely in the “lame duck” session from November 6, 2024, to January 2, 2025, or immediately after the election and before the new Congress is sworn in.
USimports of apparel and textiles from mainland China covered by the Section 301 program dropped by 41.0% in the 12 months to June 30, 2024, compared to calendar 2017. At the same time, imports of all products from mainland China under “special regime” conditions, including those imported at zero duties, climbed 102.0% higher to $5.7 billion in the past 12 months from $2.8 billion in 2017.
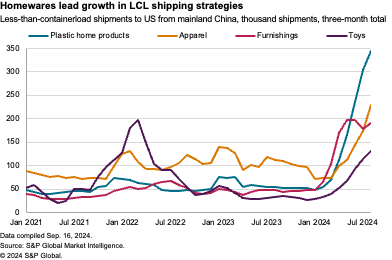
The reach of the new regulations won’t just have an impact on apparel products, nor those shipped by air. There’s been an increasing use of small-scale shipments by sea too, with the number of less-than-container load shipments from mainland China to the US having increased by 52.8% year over year in the 12 months to August 31, 2024, and by 168.8% in the past three months.
Growth has been fastest in imports of home products including plastic homewares, which grew by 538.2% in the past three months, and home furnishings which increased by 298.7%, many of which are covered by Section 301 duties. There’s also an increased use of de minimis for the highly seasonal toys sector with 308.0% growth, which are not currently covered by the tariffs.
The apparel sector had already been well-established as a use case for smaller shipments by air, but seaborne shipments also grew by 105.5% year over year and was the second largest cluster of products using the strategy, equivalent to 13.2% of less-than-container load shipments in the past three months.
What happens next very much depends on the tactics of both Chinese exporting retailers and the European and US firms which they compete with. Replicating the cost advantage of tariff-free trade is difficult unless one moves production to a free trade area partner, which is what one of the Chinese exporters is already investigating with a factory in Mexico.
A second option is to develop more agile warehousing strategies, using a multi-layered staging approach on both a global and localized basis. While that can involve handling products more times, it can leverage the newest machine learning technologies to best match goods to the customers who want them.
Weathering the Storm: Election Uncertainties and Hurricane Aftermath
Mathew Leo Principal Manager, Research and Market Intelligence, C.H. Robinson
Within a matter of a weeks, multiple events caused large-scale supply chain disruptions in the U.S. Although the events took place between the end of September and the beginning of October, the results of the ILA strike and Hurricanes Helene and Milton will be felt for months. The U.S. East Coast and Gulf Coast ports experienced an organized labor strike from October 1–3, 2024. The parties reached a temporary, 90-day agreement through January 15, 2025. This continues to be a dynamic situation with operational delays associated with discharging vessels and clearing backlogged inland-routed containers. Hurricane Helene is estimated to have caused power outages for 5.5 million customers, spanning from Florida into Ohio. Even though Hurricane Milton is estimated to have caused less power outages, it was still a staggering 3.8 million outages and concentrated primarily within Florida.
Road closures and flooding have limited truckload capacity in the region, although most major highways and interstates have reopened. Extensive power outages lasted weeks and prolonged terminal closures plagued less-than-truckload (LTL) operations. Flooding and wind damage resulted in the need to clear rail lines of debris. While these delays are mostly temporary, the several days/weeks of these disruptions across a broad geography will leave a ripple impact on supply chains. Beyond the backlogs created, many roads remained closed due to collapses/damages, including two major interstates I-40 and I-26 which aren’t expected to reopen for many months. The impact of these closures will result in traffic being redirected to less efficient routes, meaning delayed transit times for the foreseeable future. Additionally, the recent end of the strike at U.S. East and Gulf Coast ports has resulted in resumed vessel operations. The International Longshoremen’s Association (ILA) and the U.S. Maritime Alliance (USMX) reached a 90-day agreement, with gate terminal schedules gradually returning to normal after the 3-day strike. Each day of the strike is expected to result in approximately one week of backlog at the ports, which does not include any potential increase in freight moving back to the East Coast from being previously redirected to the West Coast ports. This bottlenecking of freight at the ports will result in high demand for trucks for some time, and combined with the impacts from the hurricanes, it can have an exponential impact within the fourth quarter.
The ongoing disruptions from both hurricanes are likely to create significant backlogs in the supply chain, leading to a heightened demand for warehousing solutions. As terminals and distribution centers grapple with delays and capacity constraints, many businesses may find it necessary to secure additional warehousing space to manage excess inventory. This situation is particularly urgent for those with seasonal or perishable goods, where timing is crucial. Increased backlogs may also require longer lead times, further complicating logistics planning. Companies may need to reevaluate their inventory management strategies and consider temporary storage options to accommodate delays in shipment arrivals. The demand for warehousing is expected to surge regionally as businesses seek to mitigate the impact of these disruptions and maintain their supply chain continuity.
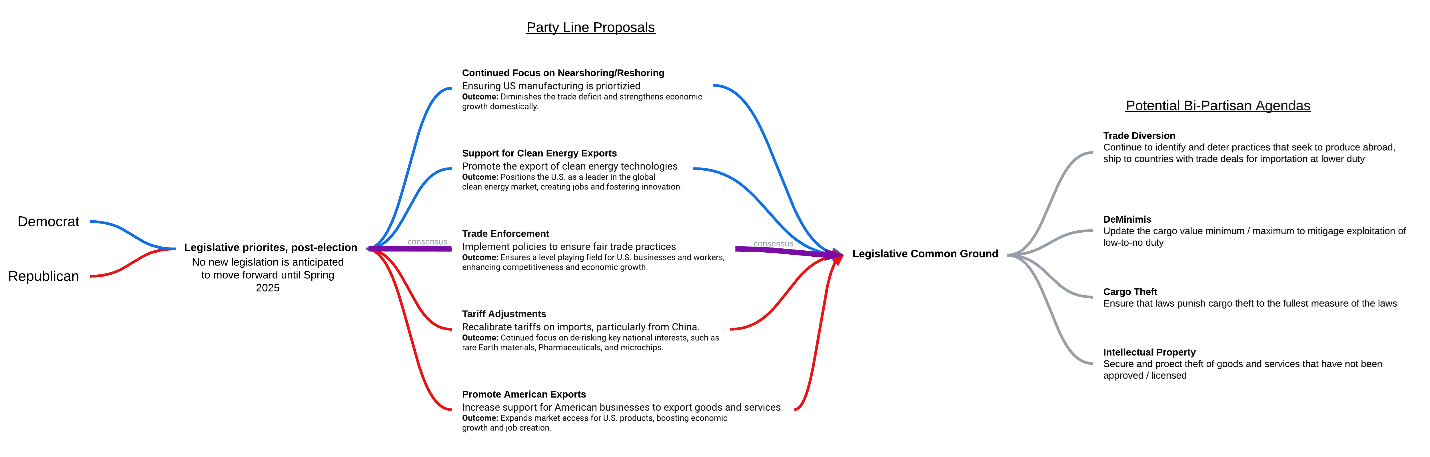
Another key factor within the fourth quarter that could impact supply chains is the U.S. election. The upcoming election is vital for the trade industry, as neither candidate intends to revert to pre-2016 trade policies. Should the Democrats win, we can expect tighter enforcement scrutiny. In contrast, Republicans see tariffs as a necessary measure against China, proposing significant increases on Chinese goods, which already faced a 50-100% rise in August.
The issue of forced labor remains central, with both parties sharing a firm stance against it. The Uyghur Forced Labor Prevention Act (UFLPA) has led to the addition of more companies to the Entity List, which now counts 68 entries. Since its implementation, over 8,465 shipments have been blocked, with about 45% eventually released. The sectors most affected include electronics, apparel, footwear, textiles, and industrial materials. Both parties are dedicated to preventing forced labor while prioritizing national interests in tariffs and trade agreements. They stress the importance of accurate shipping documentation from both buyers and sellers. U.S. trade policy is expected to remain consistent until April, with Republicans pushing for higher tariffs and Democrats focused on enforcing existing regulations.
State of Manufacturing and Its Impact on Transportation
Mike Chalfant President, MyFreightWorld
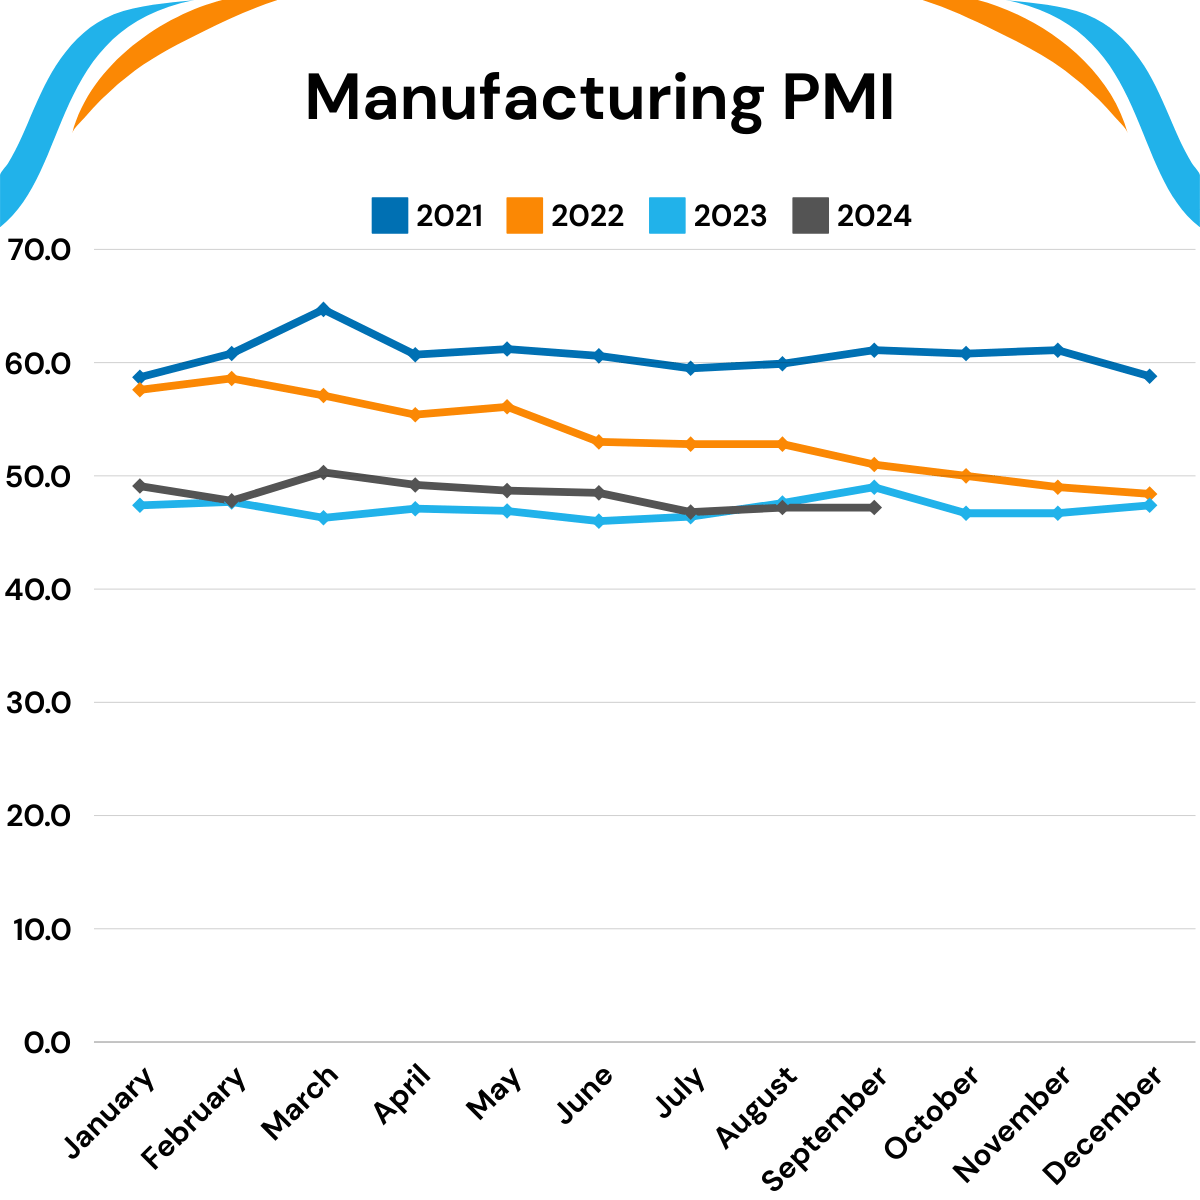
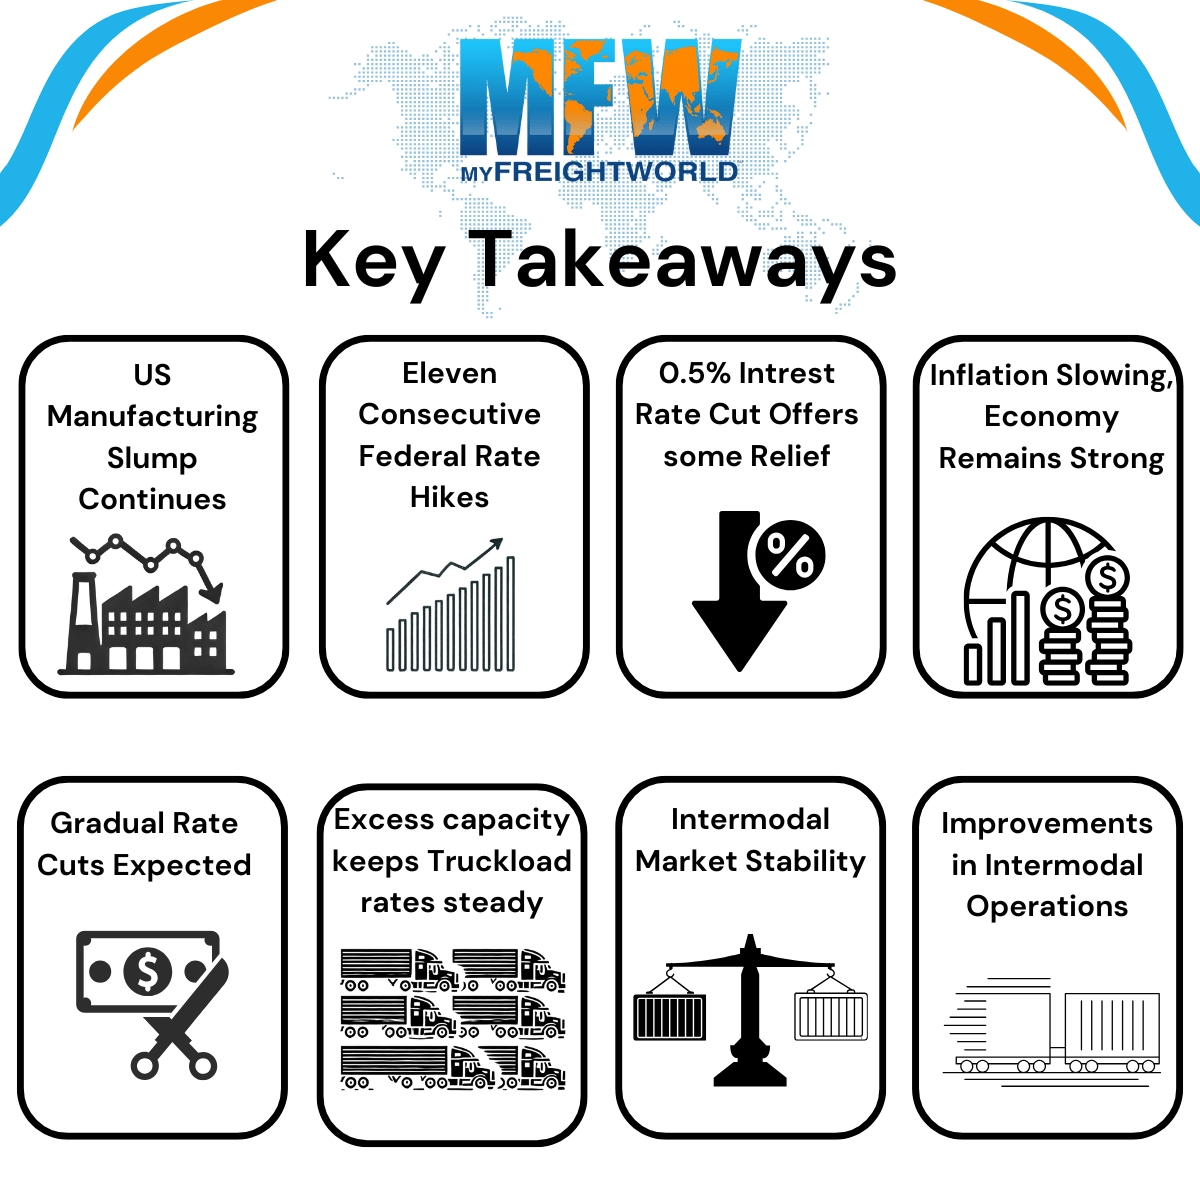
U.S. Manufacturing is in a slump, there’s no doubt about it. Per the Institute for Supply Management’s monthly PMI (Purchasing Managers’ Index), manufacturing output has fallen for six consecutive months, and 22 out of the last 23 months (about 2 years). This appears to be a direct result of eleven separate interest rate increases by the Fed from March 2022 through July 2023, when rates went from 0.25% to 5.50%. This was necessary to combat inflation, but by design decreases Capital Spending and Investment in the overall economy.
There was good news in September 2024, as the Fed announced a 50-basis point (0.5%) drop-in rate. As of October 15, 2024 – inflation appears to have slowed down, but many other metrics related to jobs (low unemployment %, increase in new jobs) and high consumer spending have indicated the market is still quite strong and there is not a strong need to dramatically lower interest rates in the near future.
It’s my opinion that we will slowly see minor rate cuts over the next 4-6 quarters, and by mid to late 2025 manufacturing output will increase as a result. Transportation rates are likely to stay relatively flat until this increase occurs, as there are still by many estimates 30% more trucking companies in the United States than there were pre-covid.
My hunch is we won’t see a major increase in trucking rates until we see an increase in manufacturing output. The market right sizing itself (supply/demand of trucks/freight) along the way could help speed up a tightening of the trucking market.
So how does this affect intermodal? Intermodal rates have remained low, as there is plenty of available capacity in the truckload market – which offers quicker transit times and better visibility. While truckload spot rates have dropped 42% since late 2020, Intermodal demand has fallen only 2% during that time span. That tells me that they are operating much closer to full capacity than the truckload market and are in prime position to increase rates if and when the spot truckload market tightens.
Intermodal operators have also made many operational, infrastructure, and technological improvements in the past few years to increase efficiency and be able to better handle the next influx of rising volumes.
Explanation of Terms
Middle Market Business Index
In partnership with the U.S. Chamber of Commerce, RSM has collected data on middle market firms since 2015 through quarterly surveys conducted by The Harris Poll. The RSM US Middle Market Business Index provides a leading measure on the performance of businesses that make up the heart and soul of our country's economy.
Logistics Managers' Index
The LMI score is a combination of eight unique components that make up the logistics industry, including: inventory levels and costs, warehousing capacity, utilization, and prices, and transportation capacity, utilization, and prices. The LMI is calculated using a diffusion index, in which any reading above 50.0 indicates that logistics is expanding; a reading below 50.0 is indicative of a shrinking logistics industry.
Industrial Real Estate Vacancy Rates
Industrial real estate vacancy rate is the percentage of available industrial property, such as a warehouse or distribution center.
United States Regional Divisions
Midwest
East North Central: Illinois, Indiana, Michigan, Ohio, and Wisconsin
West North Central: Iowa, Kansas, Minnesota, Missouri, Nebraska, North Dakota, and South Dakota
Northeast
New England: Connecticut, Maine, Massachusetts, New Hampshire, Rhode Island, and Vermont
Middle Atlantic: New Jersey, New York, Pennsylvania
South
South Atlantic: Delaware, Florida, Georgia, Maryland, North Carolina, South Carolina, Virginia, Washington DC, and West Virginia
East South Central: Alabama, Kentucky, Mississippi, and Tennessee
West South Central: Arkansas, Louisiana, Oklahoma, and Texas
WarehouseQuote’s Economic Commentary Disclaimer
The material and content used in this publication is for informational purposes only. Reference to any third party (including external hyperlinks) does not constitute or imply the endorsement of said third party. WarehouseQuote does not warrant the accuracy or completeness of the Content. The views and opinions expressed herein are those of the author and do not necessarily reflect the official policy or position of WarehouseQuote. Reproduction of the Content may be made only with the written permission from WarehouseQuote.
Chris Rogers Head of Supply Chain Research, S&P Global Market Intelligence
Mathew Leo Principal Manager, Research and Market Intelligence, C.H. Robinson
Mike Chalfant President, MyFreightWorld
About WarehouseQuote
WarehouseQuote is a managed warehousing solution helping middle market and enterprise businesses scale their warehouse operations with precision. Through our 3PL warehousing and fulfillment network of 250+ facilities, integrated technology platform, and in-house supply chain expertise, we enable businesses to design efficient fulfillment networks connected by a single technology platform. Hundreds of B2B and B2C businesses like Chatime, Joyride, Benitago Group, Big Ass Fans, and Mighty Good Solutions use WarehouseQuote to scale, streamline, and optimize their warehouse operations.