-1.9 percentdecrease in the national average of warehouse storage costs year-over-year in Q2’24 vs Q2’23, with a -1.3 percent decrease quarter-over-quarter
The national average of warehouse storage costs has seen a decrease in 6 consecutive months, but remains inflated trending two years
The Midwest region led all regions with a +1.0%increase in the average cost of warehouse storage. All other U.S. regions saw quarter-over-quarter declines in pricing
Logistics Managers’ Index, Inventory Levels, contracted to an aggregate rating of 47.4, 37.0 for downstream firms indicating leaner inventories
The Warehouse Pricing Index (WPI) is now available in Journal of Commerce’s extensive, multi-channel dashboard, Gateway. Learn more about Gateway and how WarehouseQuote is helping logistics managers make smart supply chain decisions.
The U.S. 3PL warehousing market remains in a state of below average utilization, leaving many operations with ample available space – leading to slightly more advantageous warehouse services pricing. The national warehouse pricing index saw a -1.9 percent decrease in the national average of warehouse storage costs. In this report, we’ve provided 3 key indicators for why we are seeing a decreasing in warehouse services pricing based on market data.
New 3PL and Sublease Market Capacity
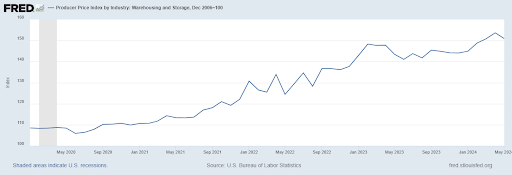
The surplus of 3PL capacity and increase in sublease capacity coupled with a 6.1%national industrial vacancy rate has provided companies with the plethora of options – most since 2020. The increase in both competition and available space appears to lead to slightly more advantageous 3PL pricing quotes seen in both the Warehouse Pricing Index and the Producer Price Index for Warehousing and Storage.
(The chart seen above is showing U.S. Producer Price Index for Warehousing and Storage from the FRED)
Downstream Inventories Remain Lean
(The chart seen above is showing the difference between Upstream and Downstream firms from the Logistics Managers' Index)
In addition to ample warehousing capacity, downstream firms generally appear to be holding less inventory than a few years ago. Most firms have been cautious about reordering new inventories and have deployed ‘read and react’ type approaches. Less inventories generally means less demand for 3PL warehousing.
The Increase in Adoption of Transloading and Cross-Docking Strategies
Over the last 12 months, warehouse services pricing has slightly declined. However, pricing is still elevated compared to where it was a few years ago. On average, inventory carrying costs generally account for 12-16% of total supply chain expenses. As warehouse services pricing has increased, many firms have deployed creative strategies such as transloading and cross-docking to reduce inventory carrying costs.
Warehousing Market Watch
6.1% National Industrial Vacancy Rate
37.0 Index Reading for Downstream Inventory Levels (LMI)
15.9% of E-Commerce Retail Sales as a Percentage of Total Sales
National Warehouse Pricing Index
The National Warehouse Pricing Index (WPI) decreased in Q2 '24 vs Q2’23,down 1.9 percent year-over-year. It appears we are starting to see favorable pricing for prospective customers as warehouses have ample capacity and downstream inventory levels have shrunk, decreasing warehousing utilization rates for facilities specializing in handling finished goods.
Regional Warehouse Pricing Index
The Midwest region is the only region with an increase in year-over-year pricing at +1.0%. The West, Northeast, and South regions saw -3.0%, -2.7%, and -2.0% declines in warehouse services pricing, respectively.
H1’24 Capacity Request Data
The voice of WarehouseQuote
"The warehousing industry currently has a supply/demand imbalance: more space than demand for warehousing. For example, overall vacancy rates have been over 5% through 2024 and the driving factor behind the availability is new construction vacancy. Renewal leasing and subleases for 2024 continue to hit record highs. Lease costs are up almost 4% on average. Visibility into labor dynamics and transportation will remain important for location optimization." - Chris Huwaldt, VP of Solutions at WarehouseQuote
The voice of the Warehouse
We interviewed several east coast 3PL operators about how they plan to prepare for this year's hurricane season.
“The primary issue with hurricane season is getting carriers into the site just before and after the storm. Employees come back to work more quickly than OTR carriers sending resources. Biggest issue for both carriers and employees is gasoline/diesel availability. We usually ask customers to move up shipments/receivers 3-5 days prior. We start to wind down operations when there is a voluntary evacuation, and we suspend operations when there is a mandatory evacuation in the jurisdiction that our warehouse is located. This year it is business as usual. We have a plan that we execute to, and it all depends on active storms and the projections to hit our area of operation.” - President, East Coast 3PL Network Partner
"Most of our warehouses have skylights, thus we are able to operate in the aftermath of a major hurricane if there's widespread power outages. We have natural gas backup generators that keep our WMS up and running. We have also setup an emergency call in number where employees can call the number to get updates on the status of our operations when serious storms are expected to hit us directly. As far as the forecast predicting a busy hurricane season is concerned, we usually play it day by day because these forecasts don't always pan out." - Operations Manager, East Coast 3PL Network Partner
Exclusive Commentary from S&P Global Market Intelligence and C.H. Robinson
Hurricanes, Strikes and Tariffs, Oh My: Peak Season Prospects
Chris Rogers Head of Supply Chain Research, S&P Global Market Intelligence
The rapid growth of containerized freight shipments into the US in the half of 2024 – including growth of 9.4% year over year in the second quarter of 2024 - has outpaced expectations and raises questions as to whether early shipments are taking place to preempt shipping congestion issues during the peak season.
Market Intelligence forecasts show US seaborne imports of containerized freight should slow steadily to 4.1% in the third quarter and 4.3% in the fourth.
Much of the surge in shipments has been on routes from mainland China, which climbed by 10.3% year over year in the second quarter but are expected to slow to low single-digit rates during the rest of the year.
A slowdown in growth does not mean that supply chains will run smoothly during the remainder of 2024, particularly given ongoing physical disruption risks as well as regulatory risks later in the year and into 2025.
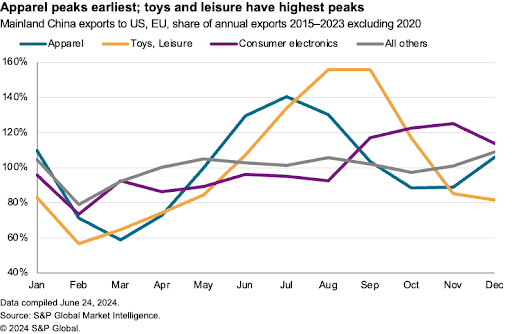
The seasonal nature of maritime shipping is driven by a cluster of consumer-related goods, most notably consumer electronics, toys and apparel.
The chart below shows exports from key Asian manufacturing centers (particularly mainland China) to consumption centers in North America and Europe typically get underway in earnest in July and continue through October, according to S&P Global Market Intelligence data.
Seasonal products (apparel, leisure goods and consumer electronics) accounted for 28.8% of mainland China exports to the EU and US in 2023, Market Intelligence data shows.
In sequence, mainland China exports of apparel typically start to rise in May before peaking in August, while toys and leisure goods rise in July and peak in September and consumer electronics rise in September and peak in October and November.
The later peak for electronics reflects a higher use of airfreight of higher value items, as well as release schedules for new mobile phone models.
Further issues are set to emerge during the remainder of the peak season, with uncertain timing, location and severity. Thematically they are not uncommon for that time of the year, though their incidence may be more serious in 2024 than in many prior years.
Weather conditions have already caused havoc for supply chains in Mexico and Brazil as well as shipping challenges in Panama and across Europe. The National Hurricane Center expects activity in the Atlantic basin to be well above normal in 2024 – Hurricane Beryl confirms that.
Trade protectionism has continued to build during 2024, including both EU and US actions to increase tariffs on imports from mainland China. President Biden’s recent expansion of Section 301 duty coverage may be contributing to early shipping patterns. Depending on the outcome of the US elections, shipments may increase on mainland China to US routes in December.
During the remainder of 2024 the largest extant risk is for strikes at US east coast ports, where initial negotiations regarding a contract that ends on Sept. 30 have been combative. Previous strike actions have had varying impacts on port operations, with the threat often proving more disruptive than the action. Typically, recovery occurred within weeks rather than months.
Supply chain decision-makers have a variety of options to mitigate the risk of late deliveries, though none are cheap, and few are easy, ranging from tactical (early shipping, inventory build) to the strategic (route choices, sourcing).
Hurricane Season and the Impact to Supply Chains
Mathew Leo Principal Manager, Research and Market Intelligence, C.H. Robinson
Summertime brings lots of pleasantries such as pool parties, barbecues, lake/beach vacations, but one negative aspect of the season (aside from mosquito bites) is hurricanes. Hurricanes form when warm ocean waters evaporate and create thunderstorms within the warm, moist air. The air pressure and earth’s rotation take it from there and build into a tropical storm. As these storms move, they thrive when surrounded by warm water and air, so the hotter the summer and ocean temperatures are, the greater chance of a hurricane forming. The National Oceanic and Atmosphere Administration (NOAA) is anticipating above-average hurricane activity this year, upwards of 25 storms, due to the current temperature of the Atlantic. The season officially lasts from June 1st through November 30th, with peak activity occurring between August and October. While it is possible that a hurricane can move through its entire lifecycle completely at sea and without making landfall, this still poses threats to supply chains.
This is due to container vessels moving goods for global trade. There can be several hundred container ships actively traversing the Atlantic on a given day, and with the Panama Canal operating at full efficiency and the persistence of issues at the Suez Canal forcing nearly all ships to reroute around the Cape of Good Hope, that makes for a lot of goods at the mercy of weather in the Atlantic Ocean. Tropical Storms and Hurricanes can cause delays and even force ships to reroute to different ports, creating more logistical issues with potential port congestion of last-minute surface transportation needs. While this congestion works to be cleared and trucks are scheduled, warehousing needs subsequently arise near these ports.
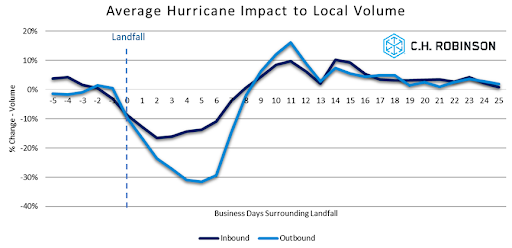
The impact of a storm’s landfall is felt differently based on several factors, such as the speed, intensity, and path of the storm. A large storm hitting a rural area with no large metropolitan areas will not have the same effect as those whose path goes through densely populated regions. Specific to transportation markets, there are three phases of a storm that affect freight: before, during, and after the storm.
Before the storm: Carrier trucks exit the area to avoid the risk associated with being in the path of the storm. Depending on the advance notice available, there can be a small influx of inbound freight in preparation of the storm (commodities such as water, shelf-stable food, lumber, generators, etc.) provided that there is enough time for those inbound trucks to safely exit the locale before landfall. If this is not possible or too risky, shippers will “stage freight” at nearby locations to allow for a swift recovery once the storm passes. This may create additional needs for temporary warehousing in those cities, for example Dallas warehousing demand may increase for staging goods in preparation for a Houston landfall.
During the storm: The focus is safety, so people and freight movements are very limited, restricted to safety and relief focused efforts. Typically, government agencies influence when people and freight can begin to move again.
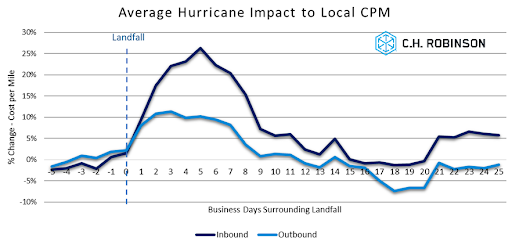
After the storm: This phase is highly impacted by the damage caused by the storm and the economic criticality of that area. There are often power outages and/or damages that prevent some shippers/receivers from reopening facilities immediately. Downed infrastructure, closed roads, and lack of available capacity results in increased rates immediately following landfall, despite volume demand being lower than normal. Once facilities have reopened, then there is a need to replenish the backlog of freight that would have moved during the past few days, on top of the standard daily needs. This results in higher-than-normal freight volumes which forces rates to remain elevated. It can take weeks for supply chains to normalize after a hurricane passes through.
The impact of hurricanes on volumes and pricing to the areas directly impacted by the storm can be visualized in these charts.
Hurricane Beryl, the first hurricane to make landfall on the U.S. this year, has already proven that this year is going to be an active storm season. Beryl becomes the first ever category 4 storm to form in June. Despite its peak strength as a category 5 storm when nearing Jamaica, it made landfall as a category 1 storm just south of Houston. Even though the storm was at a cat 1, it still caused nearly 2.8 million power outages in the East Texas region. While the infrastructural damage done by Beryl is not as much as what was caused by Hurricane Harvey in 2017, Harvey caused less power outages at approximately 2 million. This shows us the unique challenges caused by each storm, as well as the critical impact even the smaller tropical storms can have. Preparation and scenario planning is critical to avoid disruptions when a storm approaches. Even if you are not based in the area of a forecasted hurricane path, the domino effect on supply chains may have wide reaching impacts which can affect us all.
In partnership with the U.S. Chamber of Commerce, RSM has collected data on middle market firms since 2015 through quarterly surveys conducted by The Harris Poll. The RSM US Middle Market Business Index provides a leading measure on the performance of businesses that make up the heart and soul of our country's economy.
Logistics Managers' Index
The LMI score is a combination of eight unique components that make up the logistics industry, including: inventory levels and costs, warehousing capacity, utilization, and prices, and transportation capacity, utilization, and prices. The LMI is calculated using a diffusion index, in which any reading above 50.0 indicates that logistics is expanding; a reading below 50.0 is indicative of a shrinking logistics industry.
Industrial Real Estate Vacancy Rates
Industrial real estate vacancy rate is the percentage of available industrial property, such as a warehouse or distribution center.
United States Regional Divisions
Midwest
East North Central: Illinois, Indiana, Michigan, Ohio, and Wisconsin
West North Central: Iowa, Kansas, Minnesota, Missouri, Nebraska, North Dakota, and South Dakota
Northeast
New England: Connecticut, Maine, Massachusetts, New Hampshire, Rhode Island, and Vermont
Middle Atlantic: New Jersey, New York, Pennsylvania
South
South Atlantic: Delaware, Florida, Georgia, Maryland, North Carolina, South Carolina, Virginia, Washington DC, and West Virginia
East South Central: Alabama, Kentucky, Mississippi, and Tennessee
West South Central: Arkansas, Louisiana, Oklahoma, and Texas
WarehouseQuote’s Economic Commentary Disclaimer
The material and content used in this publication is for informational purposes only. Reference to any third party (including external hyperlinks) does not constitute or imply the endorsement of said third party. WarehouseQuote does not warrant the accuracy or completeness of the Content. The views and opinions expressed herein are those of the author and do not necessarily reflect the official policy or position of WarehouseQuote. Reproduction of the Content may be made only with the written permission from WarehouseQuote.
Chris Rogers Head of Supply Chain Research, S&P Global Market Intelligence
Mathew Leo Principal Manager, Research and Market Intelligence, C.H. Robinson
About WarehouseQuote
WarehouseQuote is a managed warehousing solution helping middle market and enterprise businesses scale their warehouse operations with precision. Through our 3PL warehousing and fulfillment network of 250+ facilities, integrated technology platform, and in-house supply chain expertise, we enable businesses to design efficient fulfillment networks connected by a single technology platform. Hundreds of B2B and B2C businesses like Chatime, Joyride, Benitago Group, Big Ass Fans, and Mighty Good Solutions use WarehouseQuote to scale, streamline, and optimize their warehouse operations.